Handling Black Friday Traffic with Kubernetes, Prometheus, and HPA
Introduction
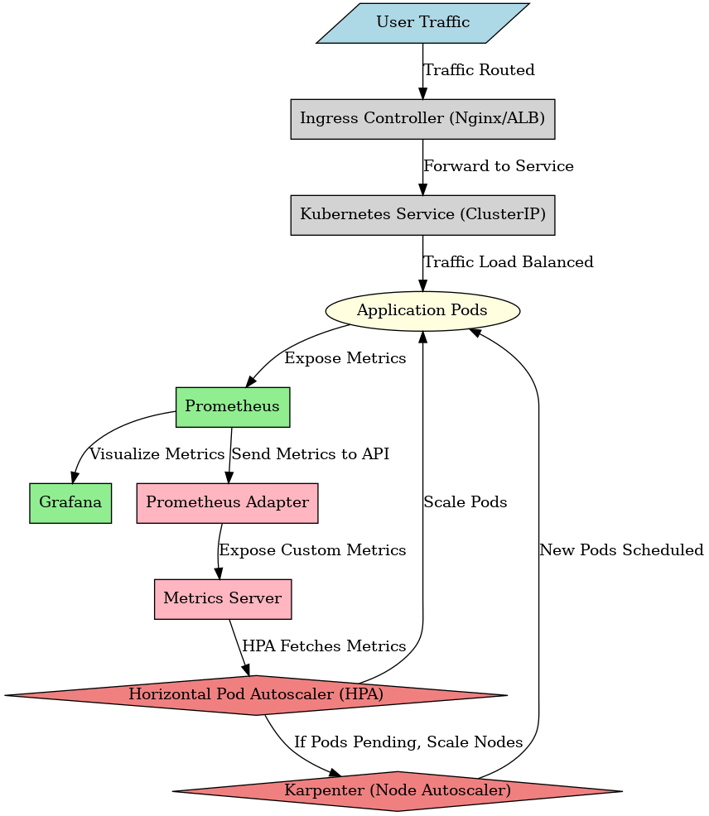
Black Friday is one of the busiest shopping days of the year, and for online platforms, it means an exponential surge in traffic. Handling this kind of load efficiently requires a well-architected system that can dynamically scale while ensuring high availability and low latency. In this post, I’ll share how I successfully managed Black Friday traffic using Amazon EKS, Prometheus, Grafana, and Horizontal Pod Autoscaler (HPA).
The Challenge
As Black Friday approached, our biggest concerns were:
Handling traffic spikes without performance degradation.
Ensuring auto-scaling worked efficiently to prevent overprovisioning or underprovisioning resources.
Monitoring system health in real time to quickly identify bottlenecks.
Optimizing cost while maintaining a seamless user experience.
To tackle these challenges, I set up Prometheus for monitoring, Grafana for visualization, HPA for automatic scaling based on custom metrics, Karpenter for node autoscaling.
The Solution
Step 1: Deploying Prometheus & Grafana on EKS
Example:
grafana url: kubectl port-forward svc/prometheus-grafana 3000:80 -n monitoring
prom url: kubectl port-forward svc/prometheus-grafana 3000:80 -n monitoring
Step 2: Exposing Custom Metrics for Auto-Scaling
#app.py
from flask import Flask
import random
import time
import os
import subprocess
import prometheus_client
from prometheus_client import Counter, Gauge, generate_latest
app = Flask(__name__)
# Define Prometheus metrics
REQUEST_COUNT = Counter("http_requests_total", "Total HTTP requests", ["method", "endpoint"])
QUEUE_DEPTH = Gauge("queue_depth", "Simulated queue depth")
MEMORY_USAGE = Gauge("process_memory_bytes", "Memory usage of the process")
@app.route("/")
def hello():
REQUEST_COUNT.labels(method="GET", endpoint="/").inc()
# Simulating queue depth fluctuation
queue_size = random.randint(0, 10)
QUEUE_DEPTH.set(queue_size)
# Safe memory usage retrieval
try:
mem_usage_output = subprocess.check_output(["ps", "-o", "rss=", "-p", str(os.getpid())])
memory_usage = int(mem_usage_output.decode().strip()) * 1024 # Convert KB to bytes
except Exception as e:
print(f"Warning: Unable to retrieve memory usage: {e}")
memory_usage = 0 # Set a default value
MEMORY_USAGE.set(memory_usage)
return "Hello from Flask App", 200
@app.route("/metrics")
def metrics():
MEMORY_USAGE.set(0) # Ensure at least one metric exists
return generate_latest(), 200, {'Content-Type': 'text/plain'}
if name == "__main__":
app.run(host="0.0.0.0", port=5000)
#Dockerfile
FROM python:3.9-slim
# Install procps (includes `ps` command)
RUN apt-get update && apt-get install -y procps
WORKDIR /app
COPY requirements.txt requirements.txt
RUN pip install -r requirements.txt
CMD ["python", "app.py"]
#requirements.txt
flask
prometheus_client
#Deployment.yaml
apiVersion: apps/v1
kind: Deployment
metadata:
name: myapp
labels:
app: myapp
spec:
replicas: 3 # Start with 3 replicas, HPA will scale it
selector:
matchLabels:
app: myapp
template:
metadata:
labels:
app: myapp
spec:
containers:
- name: myapp
image: unixcorn/eks-metrics-app:latest # Replace with your actual image
ports:
- containerPort: 5000
imagePullPolicy: Always
resources:
requests:
cpu: "100m"
memory: "128Mi"
limits:
cpu: "500m"
memory: "256Mi"
livenessProbe:
httpGet:
path: /
port: 5000
initialDelaySeconds: 3
periodSeconds: 10
readinessProbe:
httpGet:
path: /
port: 5000
initialDelaySeconds: 5
periodSeconds: 5
#svc.yaml
apiVersion: v1
kind: Service
metadata:
name: myapp
labels:
app: myapp
spec:
selector:
app: myapp
ports:
- name: http
protocol: TCP
port: 80
targetPort: 5000
type: ClusterIP
#service-monitor.yaml
apiVersion: monitoring.coreos.com/v1
kind: ServiceMonitor
metadata:
name: myapp-servicemonitor
namespace: monitoring
labels:
release: prometheus
spec:
selector:
matchLabels:
app: myapp
namespaceSelector:
matchNames:
- default
endpoints:
- port: http
path: /metrics
interval: 10s
% k get po -o wide
NAME READY STATUS RESTARTS AGE IP NODE NOMINATED NODE READINESS GATES
myapp-67db6459f8-2k92g 1/1 Running 0 55m 10.0.137.27 ip-10-0-143-51.ec2.internal <none> <none>
myapp-67db6459f8-b9pd9 1/1 Running 0 55m 10.0.129.82 ip-10-0-130-142.ec2.internal <none> <none>
myapp-67db6459f8-cmdxl 1/1 Running 0 55m 10.0.156.32 ip-10-0-144-66.ec2.internal <none> <none>
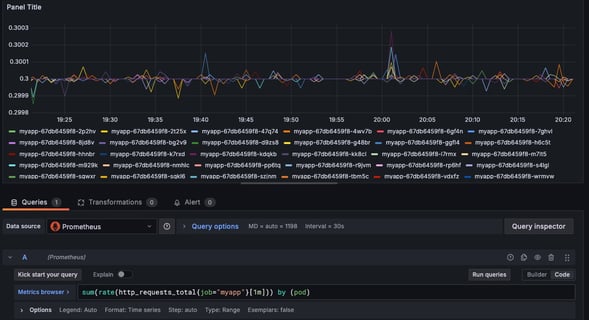
Now check if you are able to see custom metrics in Grafana dashborad using the following PROMQL queries:
sum(rate(http_requests_total{job="myapp"}[1m])) by (pod)
Set the visualization type to "Graph" or "Time series"
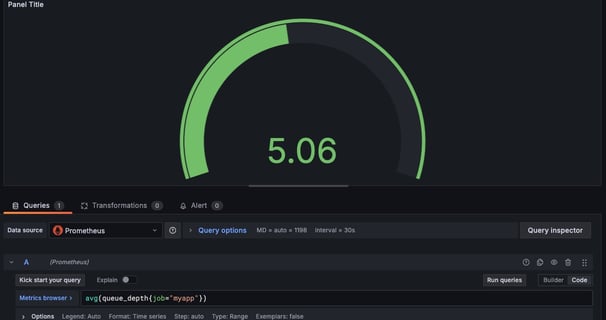
avg(queue_depth{job="myapp"})
A "Gauge" visualization can effectively represent this metric.
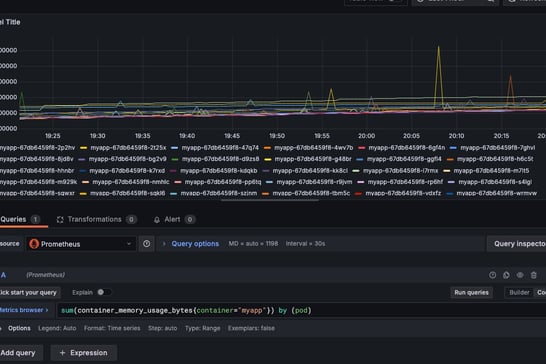
sum(container_memory_usage_bytes{container="myapp"}) by (pod)
Visualize this using a "Graph" or "Time series" panel, setting the unit to "bytes" for clarity.
Step3: Install and configure HPA Config
Install metrics server
Install Prometheus Adapter for custom metrics
helm install prometheus-adapter prometheus-community/prometheus-adapter --namespace monitoring
% kubectl get --raw "/apis/custom.metrics.k8s.io/v1beta1" | jq .
{
"kind": "APIResourceList",
"apiVersion": "v1",
"groupVersion": "custom.metrics.k8s.io/v1beta1",
"resources": []
}
I dont see custom metrics, so fix prometheus-adapter configmap which should have your custom metrics passed:
apiVersion: v1
data:
config.yaml: |
rules:
- seriesQuery: '{__name__=~"^container_.*",container!="POD",namespace!="",pod!=""}'
seriesFilters: []
resources:
template: "<<.Resource>>"
name:
matches: ^container_(.*)_seconds_total$
as: ""
metricsQuery: sum(rate(<<.Series>>{<<.LabelMatchers>>,container!="POD"}[5m])) by (<<.GroupBy>>)
- seriesQuery: '{__name__=~"^container_.*",container!="POD",namespace!="",pod!=""}'
seriesFilters:
- isNot: ^container_.*_seconds_total$
resources:
template: "<<.Resource>>"
name:
matches: ^container_(.*)_total$
as: ""
metricsQuery: sum(rate(<<.Series>>{<<.LabelMatchers>>,container!="POD"}[5m])) by (<<.GroupBy>>)
- seriesQuery: '{namespace!="",__name__!~"^container_.*"}'
seriesFilters:
- isNot: .*_total$
resources:
template: "<<.Resource>>"
name:
matches: ""
as: ""
metricsQuery: sum(<<.Series>>{<<.LabelMatchers>>}) by (<<.GroupBy>>)
- seriesQuery: 'http_requests_total{namespace!="",pod!=""}'
resources:
template: "<<.Resource>>"
name:
matches: "http_requests_total"
as: "http_requests_per_second"
metricsQuery: 'sum(rate(http_requests_total{<<.LabelMatchers>>}[1m])) by (<<.GroupBy>>)'
- seriesQuery: 'queue_depth{namespace!="",pod!=""}'
resources:
template: "<<.Resource>>"
name:
matches: "queue_depth"
as: "queue_depth_value"
metricsQuery: 'avg(queue_depth{<<.LabelMatchers>>}) by (<<.GroupBy>>)'
- seriesQuery: 'process_memory_bytes{namespace!="",pod!=""}'
resources:
template: "<<.Resource>>"
name:
matches: "process_memory_bytes"
as: "memory_usage_bytes"
metricsQuery: 'sum(process_memory_bytes{<<.LabelMatchers>>}) by (<<.GroupBy>>)'
kind: ConfigMap
metadata:
name: prometheus-adapter
namespace: monitoring
% kubectl get --raw "/apis/custom.metrics.k8s.io/v1beta1" | jq | grep -i pods | egrep -i 'http_requests_per_second|queue_depth_value|memory_usage_bytes'
"name": "pods/http_requests_per_second",
"name": "pods/queue_depth_value",
"name": "pods/memory_usage_bytes",
% kubectl get --raw "/apis/custom.metrics.k8s.io/v1beta1/namespaces/default/pods/*/http_requests_per_second" | jq .
Now define HPA config
apiVersion: autoscaling/v2
kind: HorizontalPodAutoscaler
metadata:
name: myapp-hpa
namespace: default
spec:
scaleTargetRef:
apiVersion: apps/v1
kind: Deployment
name: myapp
minReplicas: 3
maxReplicas: 50
metrics:
- type: Pods
pods:
metric:
name: http_requests_per_second
target:
type: AverageValue
averageValue: 300m
- type: Pods
pods:
metric:
name: queue_depth_value
target:
type: AverageValue
averageValue: 5
- type: Pods
pods:
metric:
name: memory_usage_bytes
target:
type: AverageValue
averageValue: 200Mi
% k get hpa
NAME REFERENCE TARGETS MINPODS MAXPODS REPLICAS AGE
myapp-hpa Deployment/myapp 286m/300m, 3500m/5 + 1 more... 3 50 8 8m26s
By looking at the above output we can confirm that HPA is able to read custom metrics and able to scale replicas of myapp deployment to 8 which was initially only 3.
